
Put a flight-time chart on your Dashboard
The Monthly Flight Time chart can sit on your Dashboard as well as in Reports. A chart takes 2 of the 6 iPhone slots, so on a full Dashboard its Show on Dashboard switch is dimmed until you free two.
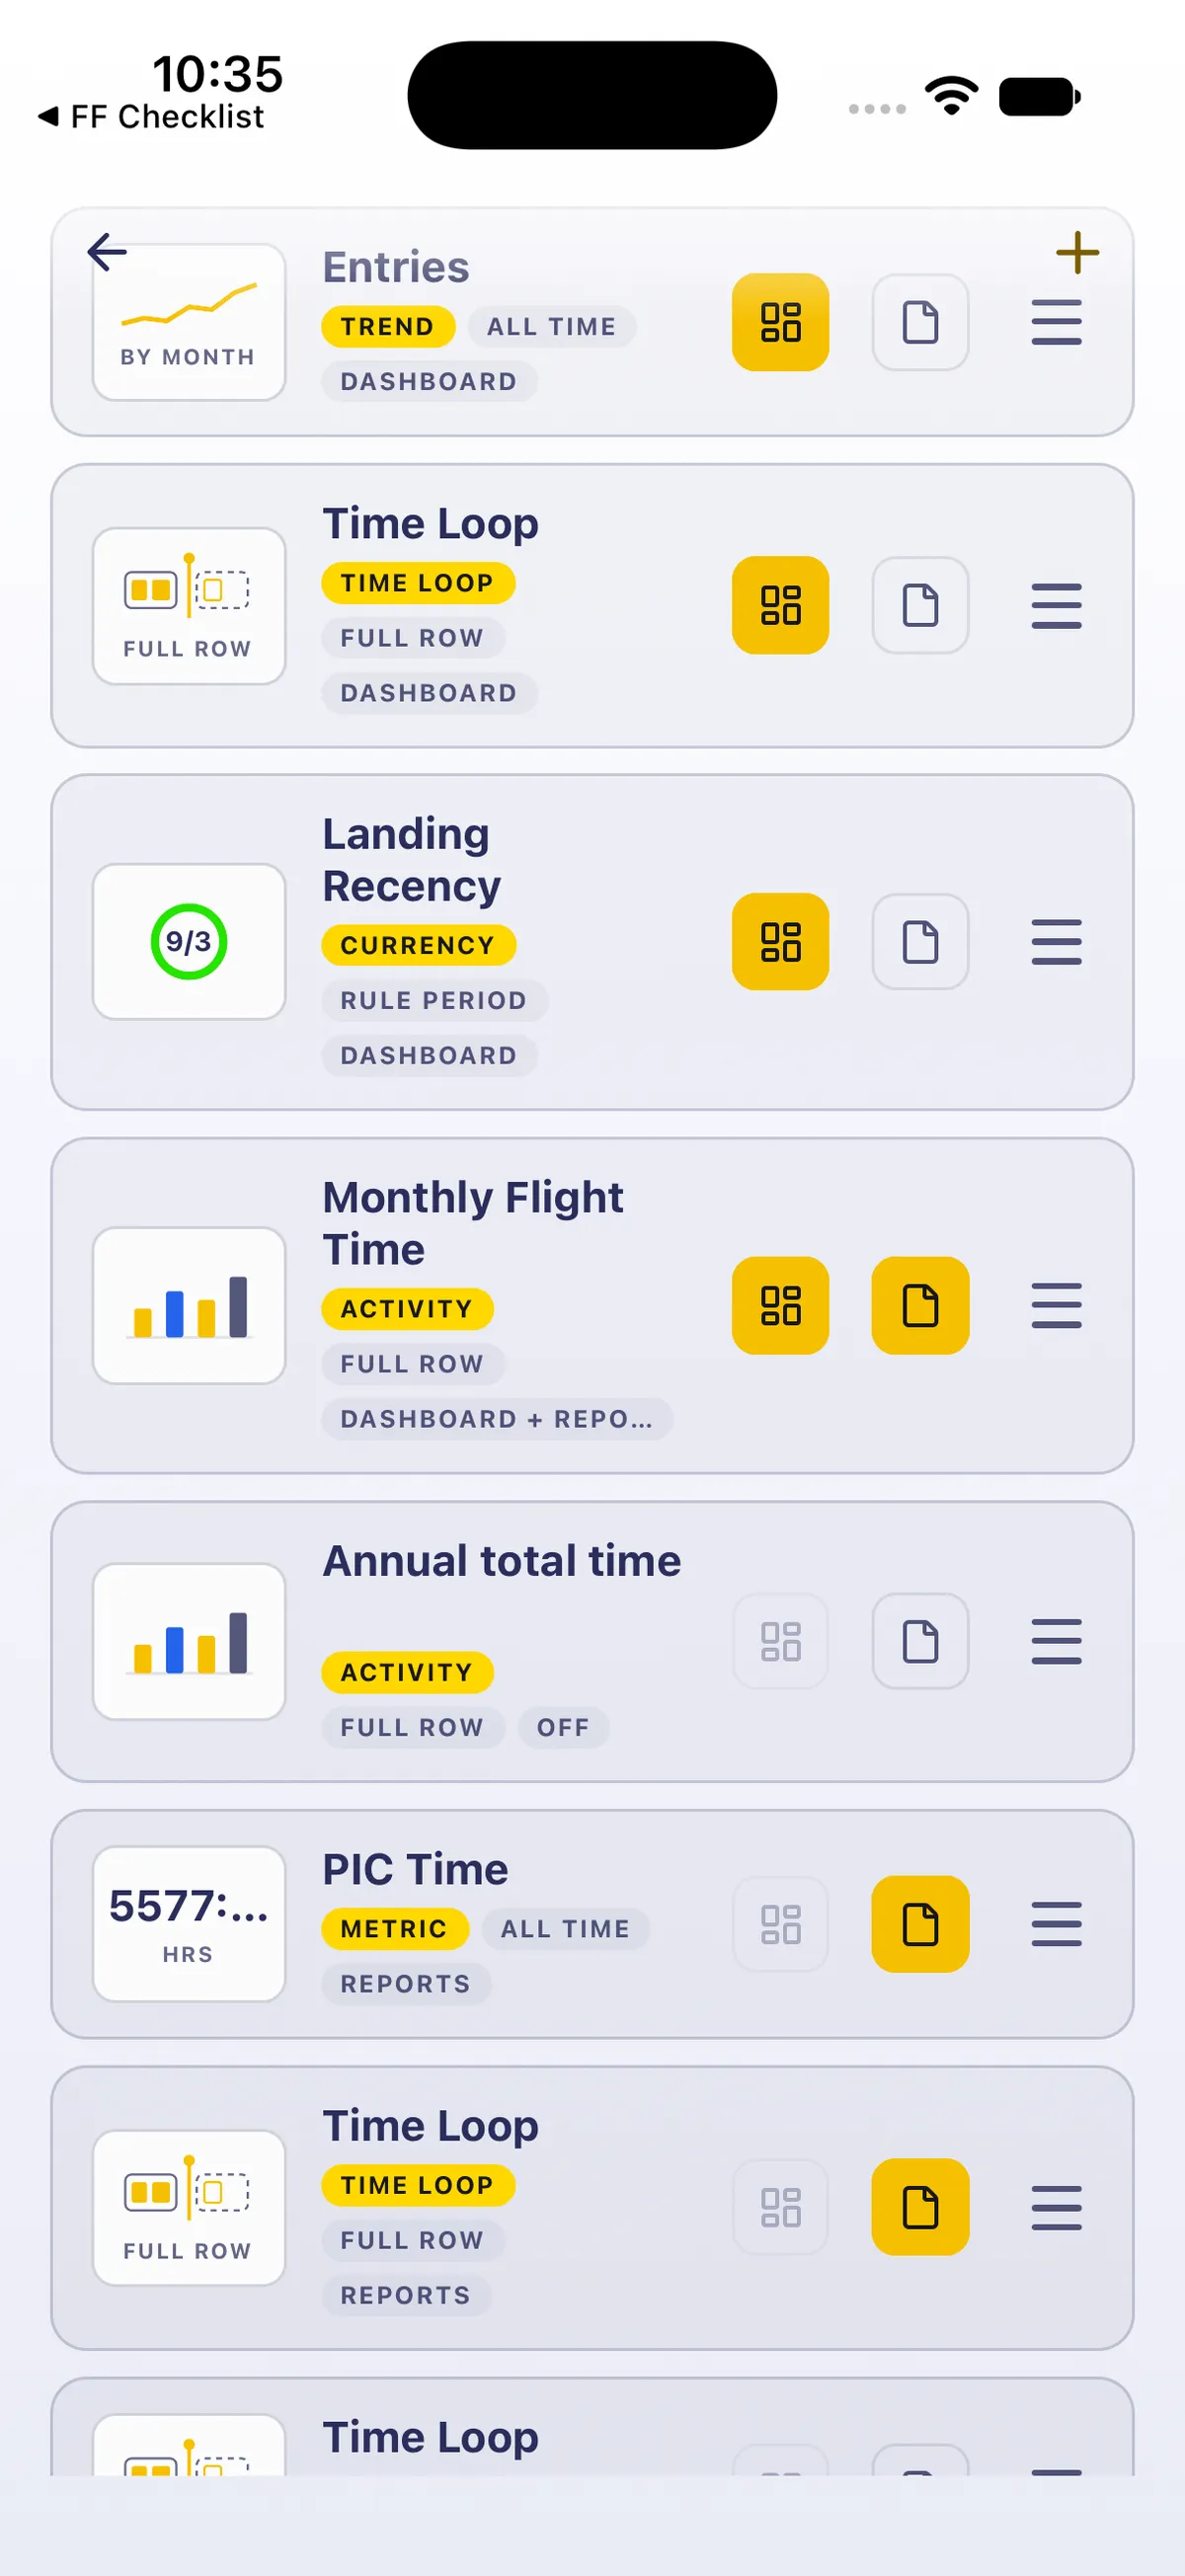
On Widgets, each row has two icon switches on the right: Show on Dashboard (the grid icon) and Show in Reports (the page icon). A chip under the name says where the widget shows: DASHBOARD, REPORTS, DASHBOARD + REPORTS or OFF. Tap the switch itself: tapping elsewhere on the row opens the widget’s editor (leave it with ← to change nothing).
1. Slots, and what each widget takes
Section titled “1. Slots, and what each widget takes”- An iPhone Dashboard has 6 slots. DASHBOARD SLOTS near the top of Widgets counts them, for example 4 of 6 used.
- Time Loop and any Activity chart, such as Monthly Flight Time, take 2 slots each (their rows show FULL ROW). Every other widget takes 1.
- Show on Dashboard only works when the widget fits in the free slots. If it doesn’t fit, the switch is dimmed. With one slot free, one-slot widgets can go on but charts and Time Loop can’t.

2. Turn the chart on
Section titled “2. Turn the chart on”- On the Dashboard, tap the settings button (top right). Widgets opens.
- If DASHBOARD SLOTS shows fewer than 2 free, turn Show on Dashboard off on widgets you can spare until two slots are free. Each one you turn off moves below the widgets still on the Dashboard.
- Tap Show on Dashboard on Monthly Flight Time. Its chip reads DASHBOARD + REPORTS, it moves up to the end of the widgets on the Dashboard, and the meter counts its 2 slots. If that fills the Dashboard (6 of 6 used), every other widget’s Dashboard switch is dimmed. It’s still on Reports too.
- Go back (←). A widget you turn on goes after the ones already on the Dashboard. To move it, drag its ☰ handle on Widgets.
3. Read it on the Dashboard
Section titled “3. Read it on the Dashboard”Scroll down to see all of it: MONTHLY FLIGHT TIME with D W M Y (M selected), your block time for the last 12 months (Block time · h · last 12 months), This month with its hours, View entries, a bar for each month and a dashed AVG line. Until you scroll, the Import and Log Flight buttons can cover the bottom of the chart.
- Tap a bar to read its month in place of This month, for example Sep 2026 · 125:43 h ▲. The arrow means that month is above the average line. See What AVG on your flight-time chart means.
- Tap the selected bar again to go back to This month.
- View entries opens the flights behind the chart (Chart, Table and Records). See See the flights behind a number.

4. Undo it
Section titled “4. Undo it”- Widgets → Show on Dashboard off on Monthly Flight Time. Its chip goes back to REPORTS and its 2 slots are free again.
- Turn Show on Dashboard back on for any widgets you turned off, in the order you want them: each one goes back on at the end of the Dashboard.
Good to know
Section titled “Good to know”- Turning Show on Dashboard off doesn’t delete a widget. It stays in the Widgets list with its settings, ready to go back on. Swiping a row left and tapping Delete is what deletes it, and the app asks first.
- Holding a widget on the Dashboard opens a menu: Edit Widget, Rearrange Widgets… and Remove Widget. Remove asks first.
- Show in Reports is separate. The chart stays on Reports → Summary while it’s on the Dashboard; you don’t need to touch it.
- Each device type keeps its own Dashboard, and widget settings sync to every device.
- On iPad the Dashboard has 10 slots. This guide is iPhone only.
On iPad
Section titled “On iPad”On iPad, Edit widgets at the top right opens Widgets as a centred sheet, with Tablet layout first.


Related: Customize your Dashboard · What AVG on your flight-time chart means · Set goals and chart your flying · Track more currencies than your Dashboard holds · See trends in your flying